DECORTE DESIGNS
FRONT WING CFD ANALYSIS
For this project, I wanted to do a case study on the aerodynamics of a front wing that is typically seen on Formula-style cars. I am a fan of the sport and have always been intrigued by the designs of the wings used on those cars, so I decided to model and analyze my own version. The goal for this project was to design a proof of concept wing and perform some basic computational fluid dynamics (CFD) analysis to determine the drag and lift forces of the wing and nose cone assembly.


Examples of Formula 1 Front Wings
Most of the front wings used in practice today consist of multiple elements; however, for this project, I chose to model a single element wing for the sake of simplicity. I started by deciding on an airfoil profile. I chose to use the NACA 6409 profile which has a high lift-to-drag coefficient ratio and would be straightforward to plot/loft in SolidWorks. The plot for the lift-to-drag coefficient ratio compared to angle of attack (AoA) shows that the ratio peaks at ~5-degrees. Given that the wing for this use case isn't expected to rotate during use or experience significant vertical velocities, I chose to plot the wing profiles at that AoA to maximize downforce. I used www.airfoiltools.com to generate profiles of the wing with varying chord lengths. I decided to make the middle of the wing longer so that I could have more lifting area while staying away from the boundary layer formed by the nose cone. I also reduced the length at the ends of the wing to reduce the risk of the wing experiencing an excessive cantilever moment and subsequent stresses.
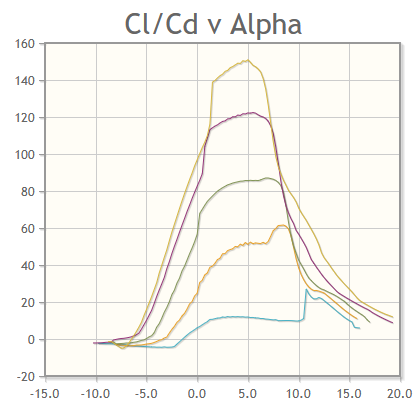
NACA 6409 Lfit-to-Drag Coefficient vs Angle of Attack
Source: airfoiltools.com


NACA 6409 Profile Inverted with 5-degree Angle of Attack and Multiple Chord Lengths
Once I had the information for the airfoil, I began creating the model in SolidWorks. I started with the nose cone that the wing would ultimately be mounted to. Without access to any drawings or diagrams, I mostly estimated dimensions based on visual references. I then added in reference planes that I would need to create cross-sections for the wing and added a reference curve to help visualize the shape of the leading edge of the wing. Using the reference planes, I imported the airfoil profiles and converted them to sketches. Next, I added splines connecting the cross-sections that would act as guide curves for the loft feature and help control the shape of the wing. After lofting through the profiles to create the wing, I added end caps to the wing to restrict the flow of air over the tips from the high-pressure side of the wing to the low side.


Reference Planes and Sketches to Create Geometry


Final Model
The next step was to import the model into my computational fluid dynamics (CFD) software. I used a free version of SimFlow, which utilizes an open source solver known as OpenFOAM. I adjusted the simulation domain so that the end of the nose cone was outside the simulation to negate any parasitic drag from the flat wall on the end. Then, I created the mesh for the wing using SimFlow's built-in meshing tool. Lastly, I set the operating conditions for the simulation. I set the domain to be free-stream and set the values for pressure and velocity to 101,325-Pa (1-atm) and 75-m/s, respectively. I used atmospheric pressure because I felt that was a suitable baseline to use for an initial analysis, and I set the direction of the velocity to be facing the wing and chose 75-m/s (~160-mph) to simulate the forces generated when the car is driving down a straight.

Isometric View of the Simulation Domain

Meshed Version of the Wing Used for the Simulation
As shown in the images below, the simulation calculated the drag and downforce in kinematic form, and the results need to be multiplied by the density of the fluid - 1.225 kg/m^3 for air in this case - to determine the resulting force. This gives the results of a drag force of 33.6-N and a downforce of 331-N, verifying that the wing performs as expected and generates approximately ten times as much downforce as it does drag. When the data is imported into ParaView and visualized, an increase in pressure can be seen on the top side of the wing and a decrease in pressure on the bottom, which further validates the downforce results. I also created velocity slices in different orientations and at different locations on the wing to visualize the velocity results of the simulation and check for boundary layer separation. And lastly, I generated a stream trace to visualize the flow of the air as it passes over and under the wing.

Results Graph Showing Kinematic Force

Top Surface Pressure

Bottom Surface Pressure

Horizontal Velocity Slice

Vertical Midplane Velocity Slice
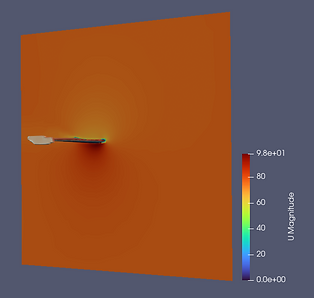
Vertical Midwing Velocity Slice

Streamline Trace of Velocity Flowing over the Wing